Blog / · 6 min read
What is a good ROAS? Break-even math and benchmarks
 Veikka Grundström Founder, upload.ad
On this page
"What is a good ROAS?" gets answered with a number like 4x, and that number is useless without your margins attached. A 3x ROAS makes one brand rich and slowly bankrupts another. The only ROAS that matters is the one your unit economics can survive, and the one worth reporting is the one your bank account agrees with.
Here is how to calculate your break-even ROAS, why the number in Ads Manager rarely matches your business results, and what typical ranges look like once you frame them honestly.
ROAS, defined properly
Return on ad spend is revenue attributed to ads divided by ad spend:
ROAS = attributed revenue / ad spend
Spend $1,000, get $3,000 in attributed revenue, and ROAS is 3.0 (often written 3x or 300%). Simple. The trouble is that "revenue" here is gross revenue, before product cost, shipping, payment fees, and returns. A 3x ROAS does not mean you tripled your money.
Break-even ROAS: the number to know first
Break-even ROAS is the ROAS at which ad spend exactly eats the profit on the sales it drives. Below it, every attributed sale loses money. The math:
Break-even ROAS = 1 / contribution margin
Contribution margin here means the share of each revenue dollar left after all variable costs of an order: cost of goods, shipping and fulfillment, payment processing, and an allowance for returns and discounts. Use this, not gross margin from your P&L, if they differ; a 60% gross margin can be a 45% contribution margin once shipping and fees land.
Example: a $100 order with $40 product cost, $10 shipping, $3 payment fees, and $2 average returns cost leaves $45. Contribution margin is 45%, so break-even ROAS is 1 / 0.45 = 2.22. At a 2.0 ROAS this store loses money on every ad-driven order, even though "2x" sounds healthy.
| Contribution margin | Break-even ROAS |
|---|---|
| 20% | 5.00 |
| 25% | 4.00 |
| 30% | 3.33 |
| 40% | 2.50 |
| 50% | 2.00 |
| 60% | 1.67 |
| 70% | 1.43 |
| 80% | 1.25 |
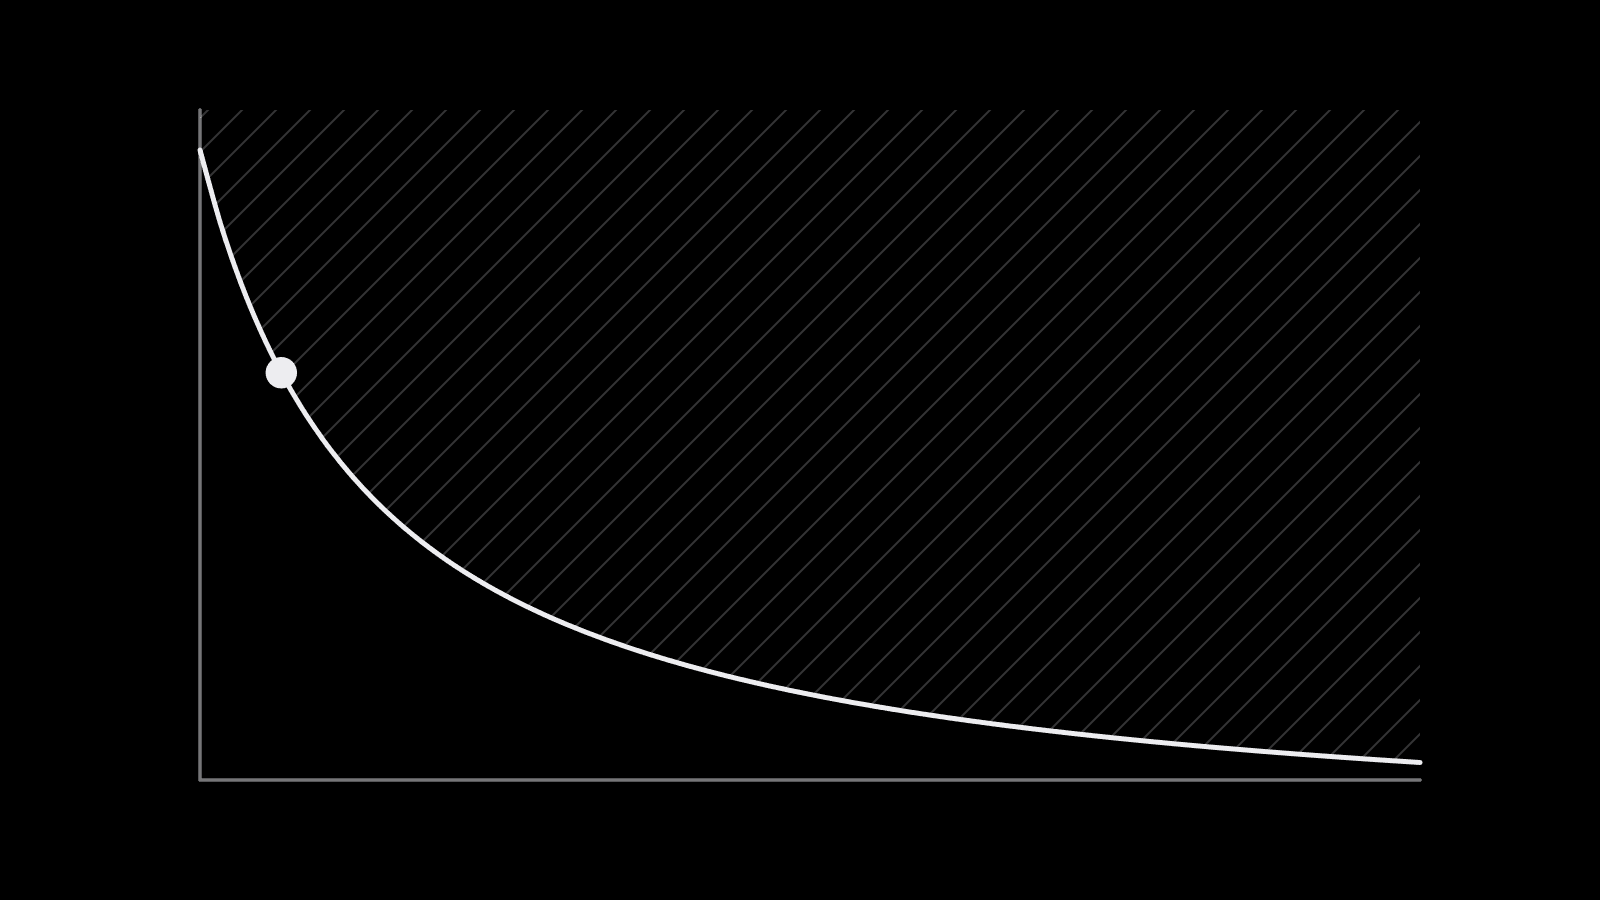
Two things this table makes obvious:
- Low-margin businesses need very high ROAS just to stand still. Reselling commodity products at 20% margin requires a 5x on every order.
- High-margin products can profitably run at ROAS numbers that look bad on a dashboard. A software subscription or a digital product at 80% margin breaks even at 1.25.
Adjusting for repeat purchases
Break-even on the first order is conservative. If customers reliably come back, you can accept a first-order ROAS below break-even and recover it on later orders. That is a lifetime value decision, and it only works if you actually measure repeat rate by cohort. Plenty of brands have justified losses with LTV assumptions they never checked.
Why platform ROAS differs from your real results
The ROAS in Ads Manager is Meta's view of which conversions its ads caused, within its attribution windows. It is not your store's view, and the two disagree for structural reasons:
- Attribution windows. Meta counts conversions within a click window and, by default, short view-through and engage-through windows. Someone who saw an ad and bought the next day counts, whether or not the ad changed their mind. Read attribution settings before comparing numbers across accounts.
- Overlapping credit. Meta, TikTok, Google, and your email platform each claim the same sale. Add up platform-reported revenue and it often exceeds your actual revenue.
- Modeled conversions. Where tracking is limited, Meta estimates some conversions. Good Conversions API setup and strong event match quality reduce how much is modeled, but some always is.
- Signal gaps in the other direction. Blocked tracking can also mean Meta undercounts, especially without server-side events.
That is why most operators track a blended number next to platform ROAS.
MER (blended ROAS)
MER = total revenue / total ad spend, across all channels, from your own sales data. It ignores attribution entirely. If MER holds steady while Meta ROAS drops, attribution moved, not demand. If platform ROAS looks great while MER falls, the platform is claiming sales it did not drive.
| Metric | Source | Answers |
|---|---|---|
| Platform ROAS | Ads Manager | Which campaigns, ad sets, and ads Meta credits |
| MER / blended ROAS | Your store or finance data | Is total ad spend paying off |
| Contribution after ads | Finance | Did the business actually make money |
Use platform ROAS to compare things inside the platform (this creative against that one, this ad set against that one). Use MER and contribution margin to decide how much to spend overall.
What typical ROAS ranges look like
There is no reliable universal average, and anyone quoting one to two decimal places is guessing. ROAS varies with margin, price point, repeat rate, vertical, attribution settings, how much of the budget is retargeting, and how aggressively you are scaling. With that caveat, these patterns hold in most accounts:
- Retargeting reports higher ROAS than prospecting, often by a wide margin, partly because it reaches people who were going to buy anyway.
- Scaling lowers ROAS. The first dollars buy the cheapest conversions; each additional dollar buys more expensive ones. A falling ROAS while you scale is expected; the question is whether it stays above break-even.
- Many ecommerce brands operate with a platform ROAS somewhere in the 2 to 4 range on prospecting, but whether that is good depends entirely on the break-even table above.
So the honest answer to "what is a good ROAS" is: any ROAS comfortably above your break-even, at the spend level you need. A 2.5 at $50,000 a month can beat a 6 at $2,000 a month if both clear break-even, because total profit is what pays the bills.
Frequently asked questions
What is a good ROAS for Facebook ads?
A good ROAS is one above your break-even ROAS, which is 1 divided by your contribution margin. A store with a 40% contribution margin breaks even at 2.5, so anything reliably above that is profitable on first orders. There is no universal good number, because margins differ.
How do I calculate break-even ROAS?
Divide 1 by your contribution margin, expressed as a decimal. Contribution margin is revenue minus product cost, shipping, payment fees, and returns, divided by revenue. For example, a 50% contribution margin gives a break-even ROAS of 2.0.
Is a 2x ROAS good?
It depends on your margin. At a 50% contribution margin, 2x is exactly break-even. At 70% it is profitable, and at 30% it loses money on every order. Compare it against your own break-even ROAS, not an industry average.
What is the difference between ROAS and MER?
ROAS is revenue attributed to a specific platform or campaign divided by its spend, using that platform's attribution. MER (marketing efficiency ratio) is total business revenue divided by total ad spend across all channels, taken from your own sales data. MER is a better check on whether overall spend is working.
ROAS moves most when you test enough creative to find the winners. upload.ad gives your team one place to review creatives and launch them into Meta and TikTok in bulk. Start free.
Veikka Grundström, Founder
I build upload.ad, the creative library and review workflow media buying teams use to get ads from edit to live on Meta and TikTok. I write about the parts of that job that waste the most time: creative testing, platform specs, review approvals, and the API behaviour nobody documents properly.