Blog / · 6 min read
Facebook ads report template: paid social reporting
Veikka Grundström Founder, upload.ad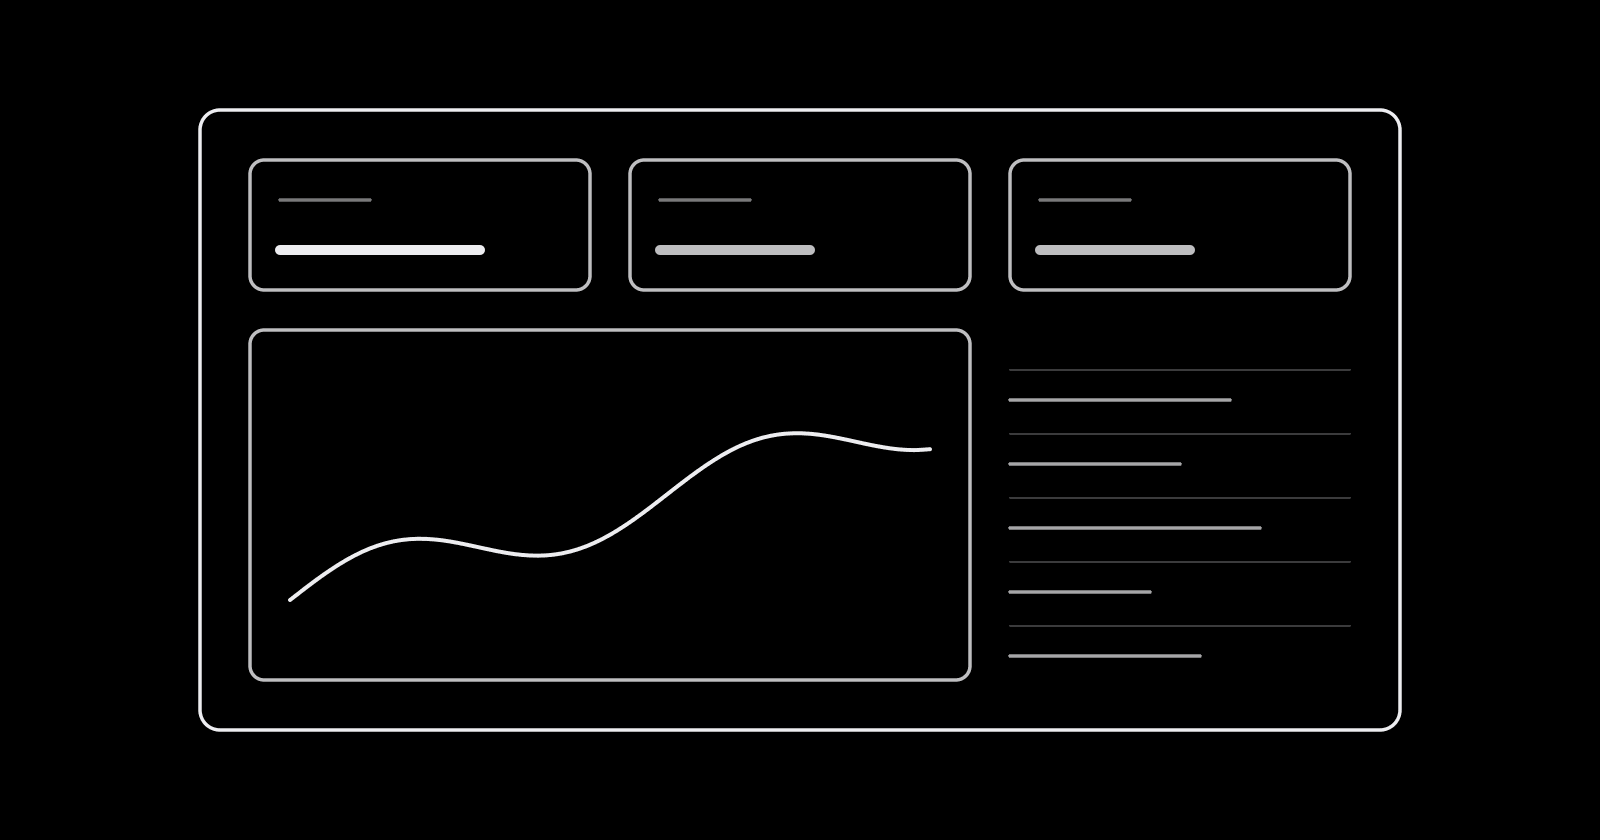
On this page
Most paid social reports are an Ads Manager export with a cover page. Forty columns from Ads Manager, a ROAS number in bold, and a paragraph written at 11pm that says performance was "stable." Whoever reads it, a founder, a CMO, or a client, closes it knowing the same things they knew before, and the next budget conversation happens on gut feel.
A good Facebook and TikTok ads report answers three questions in order: are we making money, is spend getting more or less efficient, and why. Here is how to structure it, what belongs in a weekly update versus a monthly review, how to report on creative, and how to explain the gap between platform numbers and the business's own numbers.
The metrics hierarchy
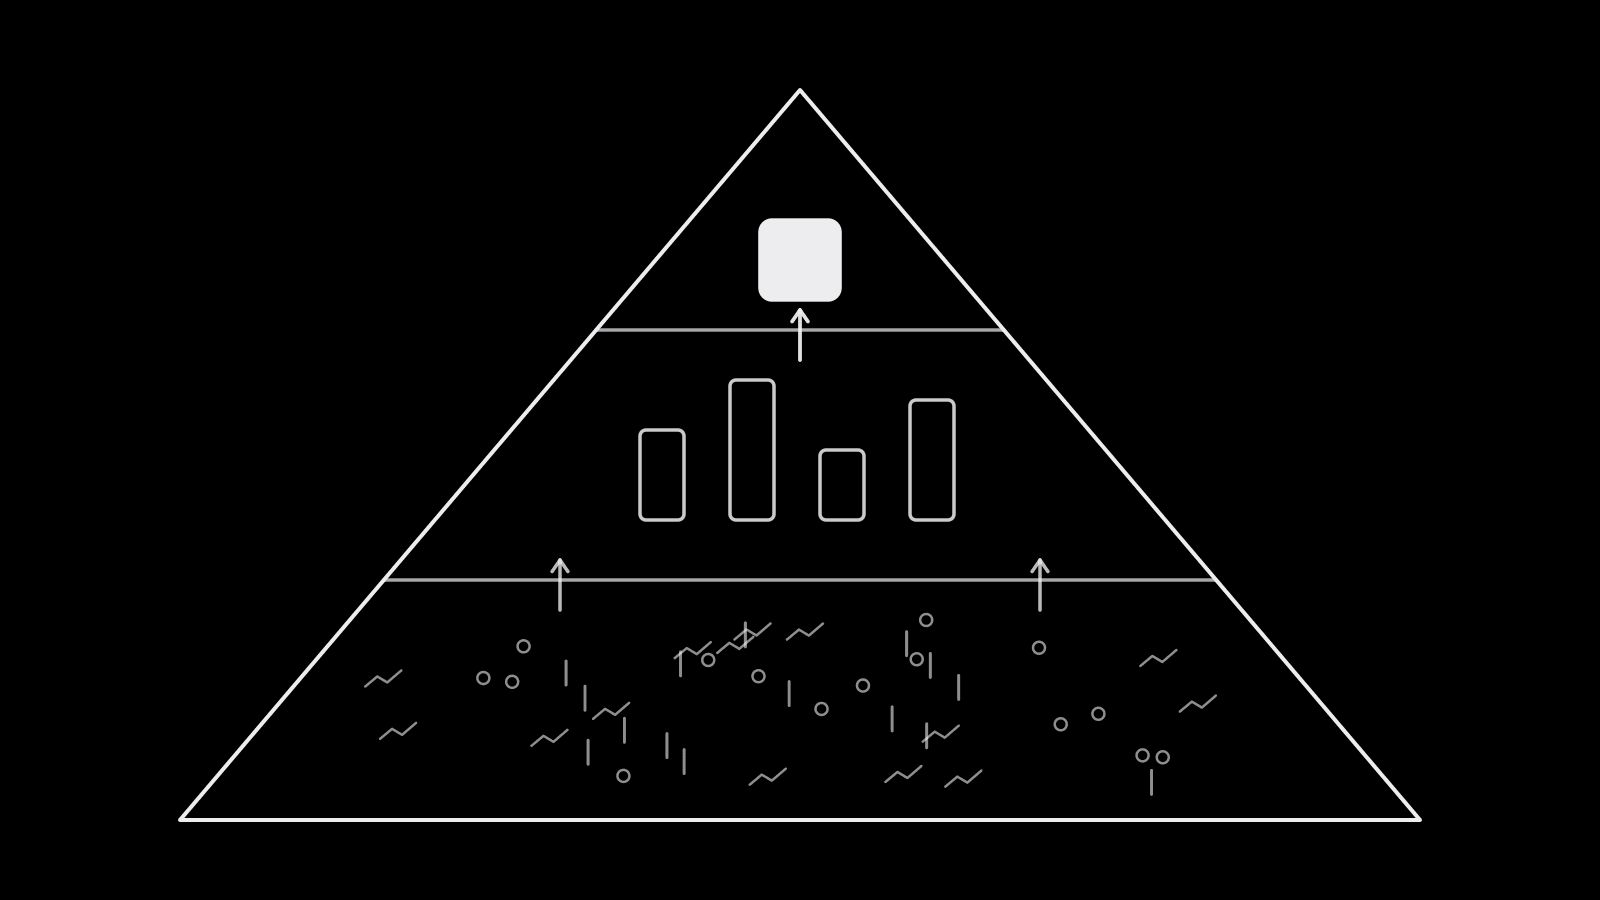
Put metrics in three tiers and never mix them on the same line. The reader should be able to stop after the first tier and still know how things are going.
| Tier | Question it answers | Typical metrics | Who cares |
|---|---|---|---|
| 1. Business outcome | Is paid social growing the business? | Revenue, new customers, qualified leads, blended CAC, MER (total revenue divided by total ad spend) | Leadership, finance, clients |
| 2. Efficiency | Is spend working harder or softer than last period? | Platform CPA, ROAS, cost per lead, spend, new customer share | Marketing leads, media buyers |
| 3. Diagnostic | Why did tier 2 move? | CPM, CTR, hook rate, hold rate, frequency, conversion rate, cost per add to cart | Media buyers, creative team |
The common mistake is leading with tier 3. A CTR increase on its own tells the reader nothing about money; treat it as a clue. Diagnostics belong in the report only when they explain a movement in tiers 1 or 2.
Tier 1 should come from the business's own system (Shopify, the CRM, the finance sheet), not from Ads Manager. Platform-reported numbers belong in tier 2, labeled as platform-reported. That one habit prevents most of the arguments about whose numbers are right.
For judging whether a ROAS figure is actually good for a given margin structure, see good ROAS benchmarks.
What to report weekly vs monthly
Weekly and monthly reports have different jobs. The weekly one is operational: what changed and what are we doing about it. The monthly one is strategic: what did we learn and where should money go next.
The weekly update
Keep it short enough to read on a phone.
- Spend against plan, platform by platform.
- Tier 1 and tier 2 headline numbers against the prior week and the target.
- What moved and why, in two or three sentences, using tier 3 metrics only as the explanation.
- What we changed: new ads launched, budgets moved, ads paused, tests started.
- What is next week: the tests going live and any decisions needed from the reader.
Avoid reacting to single-week swings in the write-up. Weekly numbers on smaller accounts are noisy, and ad sets still in the learning phase will look volatile by design. Say so rather than inventing a story.
The monthly review
The monthly review earns its length by adding what a week cannot show.
- Trend lines for tier 1 and tier 2 over the last three to six months, so seasonality is visible.
- Budget allocation by platform, campaign type, and prospecting versus retargeting, with a recommendation for next month.
- Creative learnings: which angles and formats won, which fatigued, what the next brief should test.
- Test results with a clear verdict on each, including the ones that lost.
- Measurement notes: tracking changes, attribution gaps, anything that affects how the numbers should be read.
Creative-level reporting
On Meta and TikTok, creative is the biggest lever a media buyer has, so a report without creative-level detail leaves out the main thing the team actually does. Account-level ROAS tells you the result; creative reporting tells you what to make next.
Report creative by idea, not by ad ID. The same video often runs in several ad sets and ratios, so group results by concept, angle, and hook. This works only if names are consistent, which is the case for ad naming conventions that encode angle and hook in the name.
A useful creative table has, per concept:
| Column | Why |
|---|---|
| Thumbnail | Readers remember ads by how they look, not their names |
| Spend | Shows how much the platform trusted it |
| CPA or ROAS | The verdict |
| Hook rate and hold rate (video) | Whether the opening or the body is the problem |
| CTR and conversion rate | Whether the ad sells or the landing page does |
| Frequency and days live | Context for creative fatigue |
Include thumbnails. A table of names like SUM24_UGC_price_hookB_9x16 means nothing to a founder, while a grid of the top five ads gets read and discussed.
Explaining attribution gaps
Every report eventually meets the question: "Meta says 400 purchases and TikTok says 150, but we only had 480 orders. Which is right?" The honest answer is that each platform counts differently, and the report should say so once, clearly, and then stop relitigating it.
The main reasons numbers do not match:
- Different attribution windows. Meta's default setting is 7-day click and 1-day view. Longer view windows were removed from Meta reporting in January 2026, so historical comparisons across that date need care. TikTok uses its own click and view windows, set per ad group. See Facebook attribution settings for the detail.
- Double counting. A customer who saw a TikTok ad and clicked a Meta ad can be claimed by both platforms. Summing platform conversions will usually exceed real orders.
- View-through credit. Platforms credit conversions after an ad was viewed but not clicked. Some of those people would have bought anyway.
- Signal loss. Browser restrictions, ad blockers, and opt-outs mean some conversions are never reported to the platform at all. A server-side setup like the Conversions API recovers part of that.
- Reporting date. Platforms attribute a conversion to the day of the ad interaction, while the store records the day of purchase.
The practical fix is to report both views side by side: business-side totals (orders, revenue, MER) as the source of truth for tier 1, and platform-reported numbers as a relative signal for comparing campaigns and creatives against each other. Keep the attribution setting the same across periods, and note any change in the measurement section.
Frequently asked questions
What should be included in a Facebook ads report?
A Facebook ads report should include spend against plan, business outcomes from your own sales or CRM data, platform efficiency metrics like CPA and ROAS, a short explanation of what changed and why, creative-level results grouped by concept, and the actions planned for the next period.
How often should you report on paid social performance?
Weekly for operational updates (spend, headline results, changes made, next tests) and monthly for strategy (trends, budget allocation, creative learnings, test verdicts). Daily reporting on anything but spend pacing usually adds noise rather than insight.
Why don't Facebook ads conversions match Shopify or Google Analytics?
Each tool uses a different attribution model. Meta counts conversions within its attribution window, including some view-through conversions, and can claim sales another platform also claims. Shopify and Google Analytics use their own rules. Differences are expected; report business totals as the source of truth and platform numbers for comparing campaigns.
What is MER in paid social reporting?
MER, or marketing efficiency ratio, is total revenue divided by total ad spend across all channels. Because it does not depend on any platform's attribution, it is a steady top-line check on whether paid media is working overall.
Reporting is easier when the creatives, their names, and their results sit in one place. upload.ad brings your team's Meta and TikTok creatives, reporting, and review together so creative-level results are ready when the report is due. Start free.
Veikka Grundström, Founder
I build upload.ad, the creative library and review workflow media buying teams use to get ads from edit to live on Meta and TikTok. I write about the parts of that job that waste the most time: creative testing, platform specs, review approvals, and the API behaviour nobody documents properly.